
Gold price forecast 2026–2027: what moves gold and how gold-mining stocks react
On 29 January 2026 gold touched a record of about $5,595 an ounce. The next day it fell close to 10%. By 12 October it was trading around $4,165, a little below where it started the year. If you buy gold in Dubai or watch the daily rate, you'll want to know what comes next. Nobody knows that, but plenty of banks have published a view.
This article gathers the gold price predictions that banks and research houses have published, each with its date. It also explains what moves the price, how that feeds into the AED gold rate, and how gold-mining stocks have behaved when gold rose or fell. CUSP Wealth doesn't publish its own gold forecast, so you won't find one here.
This article is for information only and is not investment advice. Forecasts are not reliable indicators of future prices.
Where gold stands now
On 12 October 2026, spot gold was around $4,165 an ounce, according to Trading Economics. That is about 3% lower than a month earlier and about 1% higher than a year ago. Gold closed 2025 at $4,319.37 after rising 64.6% in the year, its biggest annual gain since 1979, according to VanEck's December 2025 gold commentary.
The first drop came on 30 January, after Kevin Warsh was named as the next chair of the Federal Reserve. Markets saw him as a hawk, more inclined to keep rates high. March was worse. The war involving Iran pushed oil prices up, hopes of US rate cuts faded, and by 31 March gold was down more than 13% for the month, on track for its steepest monthly fall since October 2008, Reuters reported via Kitco. In September, the Fed raised interest rates for the first time since 2023, and gold fell 6.4% in the month.
In Dubai, 24-carat gold was about AED 502.75 a gram on 12 October, with 22-carat gold at about AED 465.50.
What analysts expect for 2026–2027
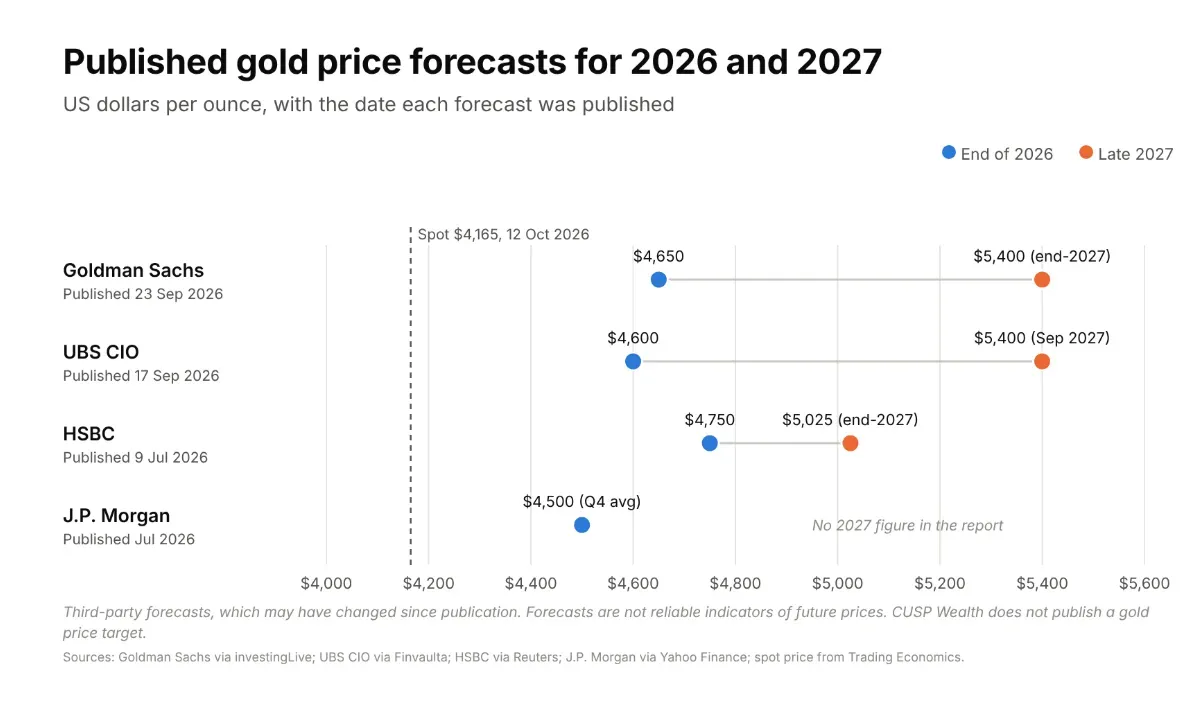
Most big banks lowered their 2026 numbers over the summer as the Fed moved towards raising rates. They still expect gold to be higher in 2027. The table shows the most recent published views we could find. Banks revise these often, sometimes within weeks, so check the date on each.
Institution | Forecast (USD per ounce) | Published | Source |
Goldman Sachs Research | $4,650 at end-2026 (cut from $4,900); $5,400 at end-2027 | 23 September 2026 | |
UBS Chief Investment Office | $4,600 (Dec 2026); $5,000 (Mar 2027); $5,200 (Jun 2027); $5,400 (Sep 2027) | 17 September 2026 | |
HSBC | 2026 average $4,560; end-2026 $4,750; 2027 average $4,925; end-2027 $5,025 | 9 July 2026 | |
J.P. Morgan | Q3 2026 average $4,300; Q4 2026 average $4,500 | July 2026 | |
World Gold Council (scenarios) | Second half of 2026: within about 5% either side of $4,100 in its central scenario; around $4,500 if the uptrend resumes | 1 July 2026 |
Third-party forecasts, shown with the date each was published. They are the opinions of the institutions named and may have changed since. The World Gold Council describes its ranges as hypothetical scenarios. Forecasts are not reliable indicators of future prices. CUSP Wealth does not publish a gold price target.
The bank forecasts put gold between $4,500 and $4,750 at the end of 2026, and between about $5,000 and $5,400 by the second half of 2027. Against the 12 October price, that would mean a rise of roughly 8% to 14% by the end of this year and 20% to 30% by late 2027, if the forecasts turn out right.
Their reasons overlap a lot. Goldman expects central banks to keep buying about 90 tonnes a month, against 17 tonnes a month before 2022, and says this accounts for nearly all the gain it expects through 2027. UBS expects official purchases of 750 to 1,000 tonnes a year. HSBC cut its numbers because of a more hawkish Fed and a firmer dollar, while saying most of the downside was probably already in the price. And they all see the Fed as the biggest risk in the short term.
Six factors that move the gold price
In its mid-year outlook, the World Gold Council estimated that geopolitical and macro risk accounted for about 16% of gold's price moves in the first half of 2026, currency moves for 15% and interest-rate expectations for only 3% (summary via Nasdaq). The weights shift from year to year, which is part of why forecasts miss.
Real interest rates and Fed decisions
Gold pays no interest. When cash and bonds pay a decent return after inflation, holding gold has a cost, and some investors sell. Analysts watch the US 10-year real yield, the return on inflation-protected Treasury bonds. In September it rose above its 2023 high of 2.58%, which the World Gold Council called a headwind for gold in its 21 September Weekly Markets Monitor.
The Fed moves those yields. On 16 September the Federal Open Market Committee raised its target range by a quarter of a percentage point to 3.75–4.00%, by 12 votes to none, and said inflation "remains elevated" (FOMC statement). The next meeting is on 27–28 October. On 12 October, futures markets put the chance of another hike by December at about 85% (CME FedWatch, via Trading Economics).
The US dollar
Gold is priced in dollars. When the dollar strengthens, gold costs more for buyers paying in rupees, yuan or euros, and demand can soften, so the two often move in opposite directions. The US dollar index rose more than 2% in September, and by mid-October the dollar was close to its strongest level in 18 months. Gold fell over the same stretch.
Central bank gold buying
Central banks bought more than 1,000 tonnes of gold a year from 2022 to 2024 and 863 tonnes in 2025, according to the World Gold Council. In the second quarter of 2026 they bought 289 tonnes, a record for a second quarter, led by Poland (51 tonnes) and China (33 tonnes). The first half as a whole was weaker at 345 tonnes, because Turkey, Russia and Azerbaijan sold heavily in the first quarter (Gold Demand Trends Q2 2026).
Reserve managers give diversification and protection against uncertainty as their main reasons. In the council's 2026 survey, a record 45% of central banks said they planned to add to their own gold over the following year. Most of the bank forecasts above lean on this buying continuing. If it slowed, they would probably all look too high at once.
Inflation
Gold has a reputation as an inflation hedge, and it has held its value over very long periods. Over shorter ones the record is patchy. Gold peaked at about $850 an ounce in January 1980 and didn't get back there until 2008, even though prices in the shops kept rising for those 28 years.
This year is a good example. US consumer prices were 3.4% higher in August than a year earlier. Persistent inflation contributed to expectations of tighter monetary policy, and the Fed's subsequent decision to raise interest rates added pressure on gold prices. Gold has usually done better in inflationary periods when central banks held rates down and real rates fell.
Geopolitical risk
Wars and political shocks often send investors towards gold, but the effect depends on what the shock does to rates and the dollar. When fighting involving Iran broke out in March 2026, gold fell. Oil prices jumped, investors expected higher inflation and fewer rate cuts, and the dollar was heading for its biggest monthly gain since July 2025.
Investment and jewellery demand
Total gold demand hit a record 5,002 tonnes in 2025, with investment demand at 2,175 tonnes, while jewellery demand fell 18% by weight (World Gold Council). High prices keep weighing on jewellery. In the second quarter of 2026, jewellery buyers took 278 tonnes, the lowest since the pandemic, although they spent 14% more in dollar terms than a year earlier. Bar and coin demand was steady at 307 tonnes.
In India, the import duty on gold went up from 6% to 15% in May 2026, and the World Gold Council expects that to cut Indian jewellery, bar and coin demand by 50 to 60 tonnes this year.
What this means for the AED gold rate
The UAE dirham has been pegged at AED 3.6725 to the US dollar since 1997, so the AED gold rate follows the dollar price of gold almost exactly. A move in the dollar against other currencies affects the dollar price of gold, but it doesn't change the conversion from dollars to dirhams.
To turn the dollar price per ounce into dirhams per gram, multiply by 3.6725 and divide by 31.1035, the number of grams in a troy ounce. That gives the value of pure 24-carat gold. For 22-carat, multiply by 22/24, and for 21-carat by 21/24.
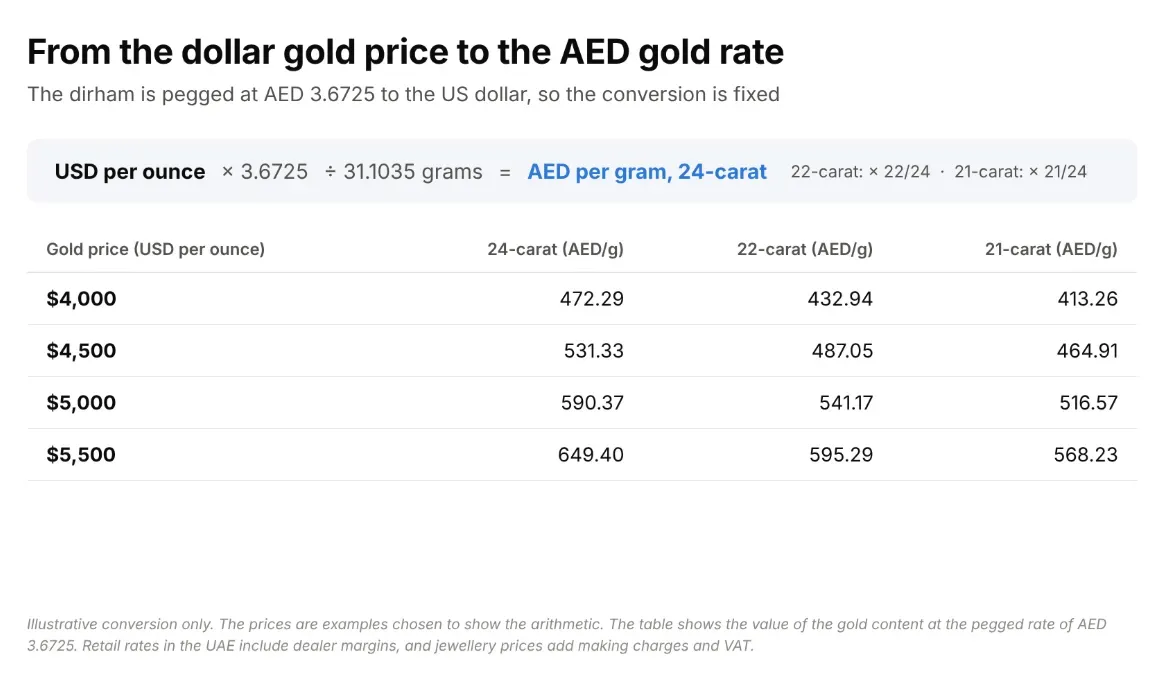
At 12 October's spot price of about $4,165, pure gold works out at about AED 492 a gram, below the 24-carat retail rate of AED 505.50 quoted earlier. The retail rate includes a dealer margin, and the spot price moves during the day, so the two won't match exactly. The Dubai Gold & Jewellery Group publishes the retail rates used by Dubai jewellers. When you buy jewellery, making charges and 5% VAT come on top. Investment-grade gold is generally zero-rated for UAE VAT where it has a purity of at least 99% and is in a form tradeable in global bullion markets, subject to applicable tax requirements.
Gold-mining stocks: why they move more than gold
A gold miner's profit is roughly the gold price minus its cost of producing each ounce. The standard measure of that cost is the all-in sustaining cost (AISC), which the World Gold Council introduced in 2013. It covers mining and processing, the spending needed to keep existing mines running, royalties and head-office costs. It leaves out spending on new mines, interest and tax.
Because costs move more slowly than the gold price, a change in gold has a bigger proportional effect on profit margins. This is called operational leverage. VanEck estimates that the sector's average AISC was about $1,600 an ounce in 2025, against an average gold price of about $3,440, and expects costs to rise by 10% to 12% in 2026.
The table below uses a made-up miner with an AISC of $1,800 an ounce.
Gold price | Margin per ounce | Change in gold price | Change in margin |
$3,600 | $1,800 | -10% | -18% |
$4,000 | $2,200 | Starting point | Starting point |
$4,400 | $2,600 | +10% | +18% |
Hypothetical example. It does not represent any real company, and it ignores tax, hedging, and the way costs such as royalties rise with the gold price.
The effect is bigger when margins are thin. In 2011, gold traded around $1,800 and average AISC was about $1,200, according to VanEck, so a 10% fall in gold cut the average margin by about 30%. Margins are much wider today, but miners still tend to move more than gold. Share prices reflect what investors expect profits to be in future years, and costs such as energy and labour don't stay still. Each company also has its own risks, such as a mine producing less than planned, a project running over budget, or a government changing the tax rules. In September 2026, one large producer's shares fell 21% in a month after it cut its production guidance.
How miners reacted in past gold rallies and falls
In each of these four periods, miners moved further than gold, whether the price was rising or falling.
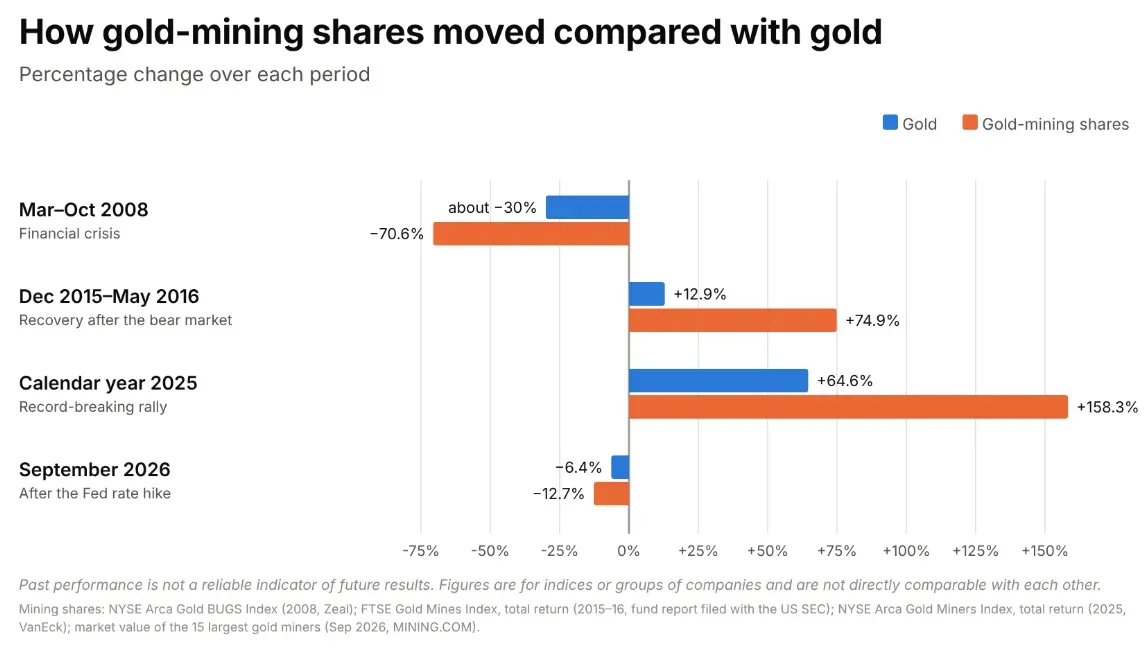
Selected historical examples using different gold-mining indices and measures. Results are illustrative, may not be directly comparable and are not reliable indicators of future performance.
The bear market that began in 2011 was slower and lasted much longer. Gold fell about 44% between September 2011 and January 2016, using World Gold Council data cited by U.S. Global Investors, and Goldman Sachs described 2015 as the fifth year in a row of negative returns for gold stocks.
Miners can also lag gold for years at a time. In its December 2025 commentary, VanEck said gold-mining shares were still valued below their historical averages after "almost two decades of persistent de-rating", which means investors had been paying less and less for each dollar of miners' earnings.
Risks: why forecasts are often wrong
At the start of 2026, several banks expected gold above $6,000 by the end of the year. J.P. Morgan raised its end-2026 forecast to $6,300 in early February (TheStreet via AOL). By July it had cut its fourth-quarter forecast to $4,500. Gold ended September at about $4,158.
Every forecast rests on assumptions about the Fed, the dollar, inflation and central bank buying, and any of them can change quickly. This year, one appointment and one war each moved gold by around 10% or more. Forecasters also read the same data and tend to revise in the same direction at the same time, so the analyst consensus can be wrong as a group.
Forecasts are not reliable indicators of future prices. Treat the table above as a record of what institutions expected on a given date.
Ways to get gold exposure
If you want to invest in gold in the UAE, two common routes are physical gold and shares in gold-mining companies. Physical gold means jewellery, bars or coins bought from a dealer. You pay a spread between the buying and selling price, plus making charges on jewellery, and you need somewhere safe to keep it. Its value follows the gold price.
Buying gold-mining shares means owning part of a listed company that produces gold. The share price has tended to swing more than the gold price, you take on the company's own risks, and some miners pay dividends. You don't own any physical gold.
FAQ
Will gold go up in 2026?
What is the gold price prediction for 2027?
What affects the gold price in the UAE?
Are gold-mining stocks better than gold?
Is gold a good hedge against inflation?
Capital at risk. The value of investments can fall as well as rise, and you may get back less than you invest. Shares in gold-mining companies can be more volatile than the gold price.
Disclaimer: This article is published for educational and informational purposes only. It does not constitute financial, investment, tax or legal advice, and it is not a recommendation or endorsement of any particular financial product, fund or service. The value of investments can go down as well as up, and you may lose some or all of your capital. Past performance is not an indicator of future results. Readers should do their own research and consult a qualified financial adviser before making any investment decisions. Advisory calls are only available to clients who meet the suitability assessment required by Cusp Wealth. Not all financial products mentioned in this blog are products or services currently available from Cusp Wealth.
Any opinions, market commentary, research, analysis, prices, statistics, forecasts or other information referred to in this article are based on information available at the time of publication. Cusp Wealth Ltd takes reasonable care to ensure the information is accurate and drawn from sources believed to be reliable, but makes no representation or warranty as to its accuracy, completeness, reliability or continued applicability. Any third-party information used in this article is provided for information only. Cusp Wealth Ltd accepts no liability for any losses arising directly or indirectly from reliance on, or misuse of, the information in this article.
Cusp Wealth Ltd is regulated by the Dubai Financial Services Authority (DFSA) and is an entity in the Dubai International Financial Centre (DIFC). The firm holds a Category 4 licence (licence number 10863, reference number F011420) and is licensed to provide financial services to both professional and retail clients, including Shari’a-compliant products, in line with its DFSA licence and Islamic endorsement.
The information in this article is current as of 12 October 2026 and is subject to change.